Podcast
Questions and Answers
What is the primary purpose of phase diagrams in drug formulations?
What is the primary purpose of phase diagrams in drug formulations?
- To select excipients and processing methods for amporphous drugs. (correct)
- To stabilize crystalline forms of drugs.
- To identify drug absorption rates.
- To determine the marketing strategy for drug products.
Which of the following is NOT a use of phase diagrams in formulations?
Which of the following is NOT a use of phase diagrams in formulations?
- Understanding suspension stability.
- Controlling drug release rates.
- Optimizing emulsion stability.
- Improving patient compliance. (correct)
In the temperature-composition diagram for the phenol-water system, what occurs when adding phenol beyond a concentration of 63% at 50°C?
In the temperature-composition diagram for the phenol-water system, what occurs when adding phenol beyond a concentration of 63% at 50°C?
- The solution becomes solid.
- Two distinct liquid phases form.
- Only one phenol-rich liquid phase is formed. (correct)
- A gas phase is generated.
What does the Critical Solution Temperature (CST) represent?
What does the Critical Solution Temperature (CST) represent?
How do phase diagrams assist in controlled release formulation design?
How do phase diagrams assist in controlled release formulation design?
Which statement accurately describes the purpose of phase diagrams in both emulsions and suspensions?
Which statement accurately describes the purpose of phase diagrams in both emulsions and suspensions?
What is the significance of the upper consolute temperature in a phase diagram?
What is the significance of the upper consolute temperature in a phase diagram?
What does a phase diagram help in establishing regarding the stability of suspensions?
What does a phase diagram help in establishing regarding the stability of suspensions?
What occurs above the Upper Critical Solution Temperature (UCST)?
What occurs above the Upper Critical Solution Temperature (UCST)?
In a ternary phase diagram, what does each corner represent?
In a ternary phase diagram, what does each corner represent?
What does a tie line represent in a two-component system?
What does a tie line represent in a two-component system?
What happens below the Lower Critical Solution Temperature (LCST)?
What happens below the Lower Critical Solution Temperature (LCST)?
What do the lines joining the corner points in a ternary phase diagram represent?
What do the lines joining the corner points in a ternary phase diagram represent?
What is represented by a point inside the triangle of a ternary phase diagram?
What is represented by a point inside the triangle of a ternary phase diagram?
What can be inferred about a system at a point along a tie line at 50°C?
What can be inferred about a system at a point along a tie line at 50°C?
What describes the area within the triangle of a ternary phase diagram?
What describes the area within the triangle of a ternary phase diagram?
What is the role of the binodal curve in a ternary system with one pair of partially miscible liquids?
What is the role of the binodal curve in a ternary system with one pair of partially miscible liquids?
How do tie lines function in a ternary phase diagram?
How do tie lines function in a ternary phase diagram?
What happens to the system when alcohol is added to a water and acetone mixture?
What happens to the system when alcohol is added to a water and acetone mixture?
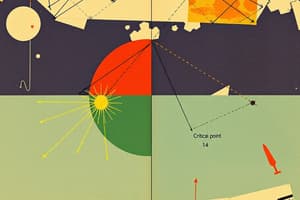
Under what conditions might you encounter a critical point in a ternary phase diagram?
Under what conditions might you encounter a critical point in a ternary phase diagram?
In the context of water, acetone, and butanol, what composition results in one phase?
In the context of water, acetone, and butanol, what composition results in one phase?
What is primarily indicated by the presence of a two-phase region in a ternary phase diagram?
What is primarily indicated by the presence of a two-phase region in a ternary phase diagram?
What typically occurs in a ternary system composed of water, acetone, and butanol when equilibrium is reached?
What typically occurs in a ternary system composed of water, acetone, and butanol when equilibrium is reached?
Which of the following statements about phase separation in ternary systems is accurate?
Which of the following statements about phase separation in ternary systems is accurate?
What happens to the components of a mixture above or below the Critical Solution Temperature (CST)?
What happens to the components of a mixture above or below the Critical Solution Temperature (CST)?
What is the significance of binodal curves and tie lines in a ternary phase diagram?
What is the significance of binodal curves and tie lines in a ternary phase diagram?
At what temperature and concentration does the phenol-water system become one liquid phase?
At what temperature and concentration does the phenol-water system become one liquid phase?
How does n-butanol affect the mixture of water and acetone?
How does n-butanol affect the mixture of water and acetone?
What type of phase behavior is observed when there are regions of partial miscibility?
What type of phase behavior is observed when there are regions of partial miscibility?
What is the primary use of understanding the phase behavior of the water-butanol-acetone system?
What is the primary use of understanding the phase behavior of the water-butanol-acetone system?
What is characterized by regions of complete miscibility in a ternary phase diagram?
What is characterized by regions of complete miscibility in a ternary phase diagram?
Which factor influences the phase separation in the water-butanol-acetone system?
Which factor influences the phase separation in the water-butanol-acetone system?
Which type of miscibility refers to the ability of two liquids to mix in all proportions?
Which type of miscibility refers to the ability of two liquids to mix in all proportions?
What is the upper critical solution temperature (UCST)?
What is the upper critical solution temperature (UCST)?
When does solubility increase with decreasing temperature?
When does solubility increase with decreasing temperature?
Which of the following solutions involves salting out?
Which of the following solutions involves salting out?
Which of these acids is known to have high solubility in water due to its hydroxyl groups?
Which of these acids is known to have high solubility in water due to its hydroxyl groups?
How does the solubility of sodium chloride typically respond to temperature changes?
How does the solubility of sodium chloride typically respond to temperature changes?
What happens to acetylsalicylic acid when sodium citrate is added to the solution?
What happens to acetylsalicylic acid when sodium citrate is added to the solution?
Which of the following best describes a mixture of phenol and water?
Which of the following best describes a mixture of phenol and water?
Flashcards are hidden until you start studying
Study Notes
Amorphous Drug Formulations
- Phase diagrams stabilize amorphous drug forms, enhancing solubility compared to crystalline forms.
- They assist in selecting excipients and processing methods to maintain the amorphous state.
Emulsion and Suspension Stability
- Phase diagrams optimize emulsions by determining the ideal ratios of oil, water, and emulsifiers for stability in formulations.
- For suspensions, they explain the conditions for maintaining uniform distribution of suspended particles to prevent settling or agglomeration.
Controlled Release Systems
- Phase diagrams inform the design of controlled release formulations, revealing interactions between drugs and polymer matrices to manage drug release rates.
Temperature-Composition Diagrams for Water and Phenol System
- The curve gbhci indicates temperature and concentration limits for liquid equilibrium; areas outside the curve represent single liquid phases.
- At point a, a single liquid phase forms until a phenol concentration of 63% at 50°C; above this, a phenol-rich phase develops.
Critical Solution Temperature (CST)
- The Critical Solution Temperature (CST) is the temperature where components in a mixture become completely miscible.
- Upper Critical Solution Temperature (UCST) is the highest temperature for phase separation; above UCST, mixtures are fully miscible.
- Lower Critical Solution Temperature (LCST) is the lowest temperature for phase separation; below LCST, mixtures are completely miscible.
Ternary Phase Diagrams
- Ternary phase diagrams represent three components (e.g., water, butanol, acetone) as corners of an equilateral triangle, indicating relative compositions within the triangle.
- The area enclosed reflects all combinations of the three components forming distinct phases.
Binodal Curves and Tie Lines
- Binodal curves define the boundaries between single-phase and two-phase regions in ternary diagrams, indicating where phase separation occurs.
- Tie lines connect equilibrium compositions in two-phase regions, defining compositions of coexisting phases.
Phase Behavior in Ternary Systems
- Understanding phase behavior in the water-butanol-acetone system aids in applications such as solvent extraction and pharmaceutical formulations.
- Diagrams illustrate areas of complete miscibility and regions of partial miscibility or phase separation based on component interactions.
Miscibility Concepts
- Complete miscibility: components mix in all proportions (e.g., water/alcohol).
- Partial miscibility: components mix in specific proportions (e.g., phenol/water).
- Immiscibility: components do not mix (e.g., water/petrolatum).
Effect of Temperature on Solubility
- Positive heat: solubility increases with temperature for endothermic substances (most salts).
- Negative heat: solubility increases as temperature decreases for exothermic substances (e.g., calcium sulfate).
- Certain salts, like sodium chloride, show no significant temperature effect on solubility.
Salting Out Phenomenon
- Salting out occurs when gases are released from a solution by adding electrolytes (like sodium chloride) or non-electrolytes (like sucrose), affecting solubility dynamics.
Studying That Suits You
Use AI to generate personalized quizzes and flashcards to suit your learning preferences.