Understand the Problem
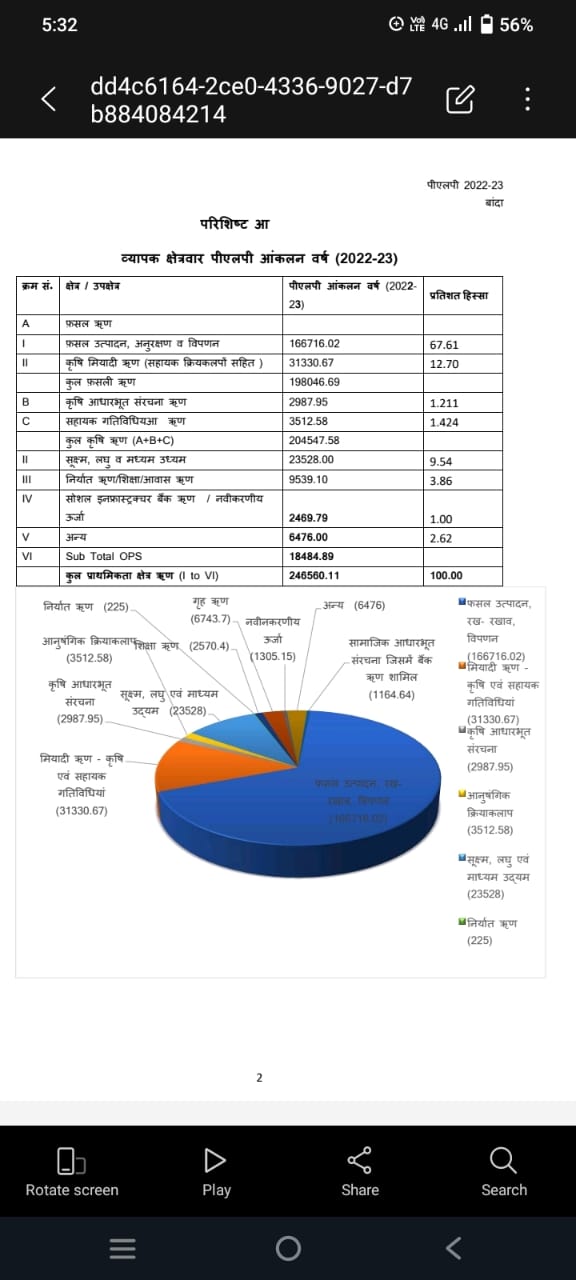
यह प्रश्न एक रिपोर्ट या डेटा के विश्लेषण से संबंधित है जो विभिन्न श्रेणियों में सांख्यिकी प्रस्तुत करता है। यह संख्याएँ विभिन्न स्तरों पर डेटा के वितरण और अनुपात को दर्शाती हैं।
Answer
The image provides estimated business data for 2022-23, showing contributions in various sectors.
The image shows estimated data for 2022-23, detailing percentages and amounts in various business categories.
Answer for screen readers
The image shows estimated data for 2022-23, detailing percentages and amounts in various business categories.
More Information
The data includes sectors like crop production, ancillary activities, and various financial sectors with their respective amounts and percentages.
AI-generated content may contain errors. Please verify critical information