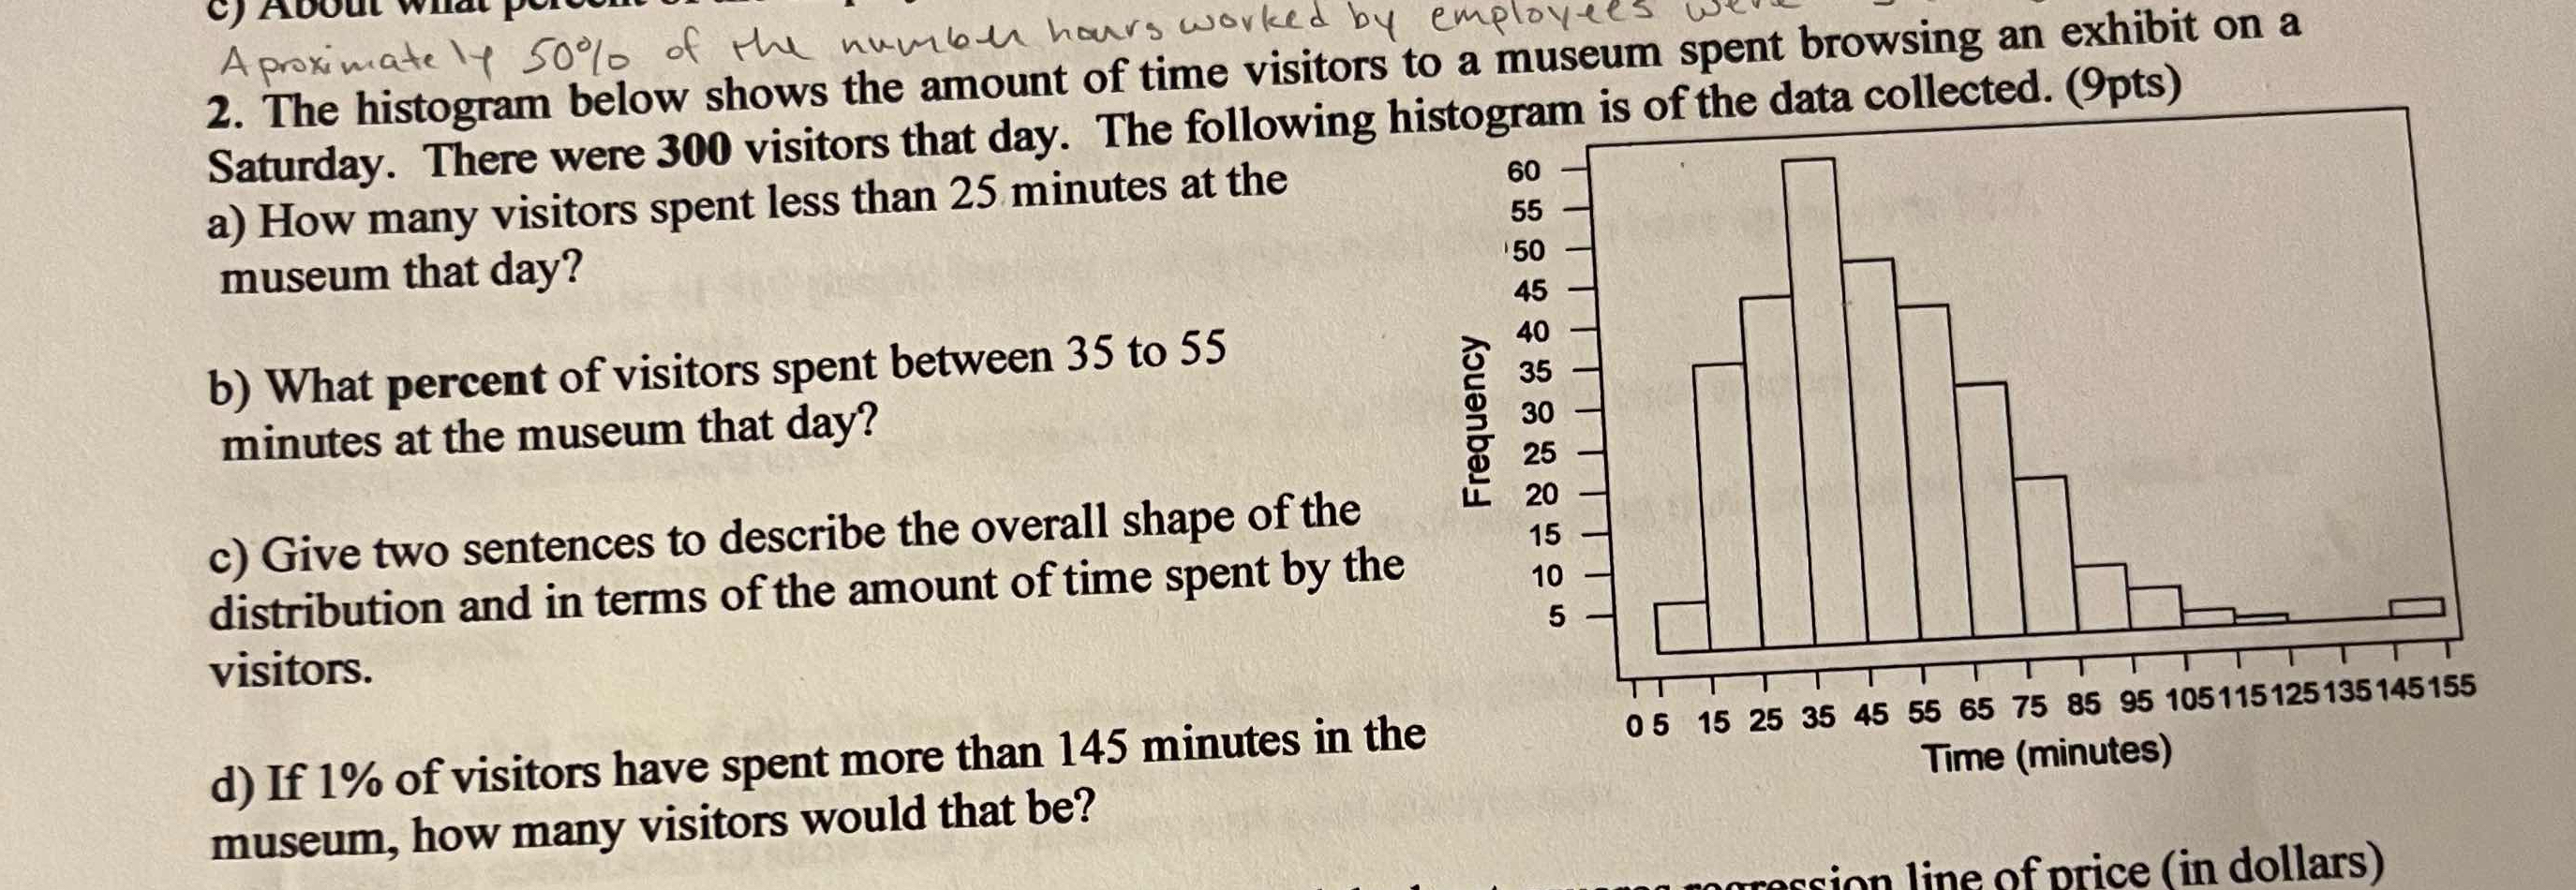
2. The histogram below shows the amount of time visitors to a museum spent browsing an exhibit on a Saturday. There were 300 visitors that day. a) How many visitors spent less than... 2. The histogram below shows the amount of time visitors to a museum spent browsing an exhibit on a Saturday. There were 300 visitors that day. a) How many visitors spent less than 25 minutes at the museum that day? b) What percent of visitors spent between 35 to 55 minutes at the museum that day? c) Give two sentences to describe the overall shape of the distribution and in terms of the amount of time spent by the visitors. d) If 1% of visitors have spent more than 145 minutes in the museum, how many visitors would that be?

Understand the Problem
The question is asking for statistical analysis of visitor data at a museum based on a provided histogram. It involves calculating visitor counts and percentages and requires descriptive analysis. The problem can be tackled by interpreting the histogram data and applying basic statistical calculations.
Answer
a) 60 visitors spent less than 25 minutes. b) 25%. c) Bimodal distribution with two peaks. d) 3 visitors.
Answer for screen readers
a) 60 visitors spent less than 25 minutes.
b) 25% of visitors spent between 35 to 55 minutes.
c) The distribution is bimodal, indicating two distinct groups of visitor durations.
d) Approximately 3 visitors spent more than 145 minutes.
Steps to Solve
-
Determine total visitors spent less than 25 minutes The histogram shows that approximately 60 visitors spent less than 25 minutes at the museum.
-
Calculate the percent of visitors spent between 35 to 55 minutes From the histogram, we observe:
- 35-45 minutes: 45 visitors
- 45-55 minutes: 30 visitors
Adding these gives: $$ 45 + 30 = 75 $$ Thus, 75 visitors spent between 35 to 55 minutes.
To find the percentage: $$ \text{Percentage} = \left( \frac{75}{300} \right) \times 100 = 25% $$
-
Describe the overall shape of the histogram The histogram displays a roughly bimodal distribution with two peaks: one around 15 minutes and another around 45-55 minutes. This suggests that visitors may have varying preferences on how long to stay.
-
Calculate number of visitors who spent more than 145 minutes From the histogram, it appears that only about 5 visitors spent more than 145 minutes. Thus, we can determine: $$ 1% \text{ of visitors} = 0.01 \times 300 = 3 \text{ visitors} $$
a) 60 visitors spent less than 25 minutes.
b) 25% of visitors spent between 35 to 55 minutes.
c) The distribution is bimodal, indicating two distinct groups of visitor durations.
d) Approximately 3 visitors spent more than 145 minutes.
More Information
The histogram provides insight into how visitors spend their time at the museum. Knowing these patterns can help museum management optimize the visitor experience by adjusting exhibits or staff.
Tips
- Miscounting the frequencies from the histogram or misunderstanding the bins can lead to incorrect calculations.
- Forgetting to convert raw visitor numbers to percentages correctly.
AI-generated content may contain errors. Please verify critical information